Search by gene
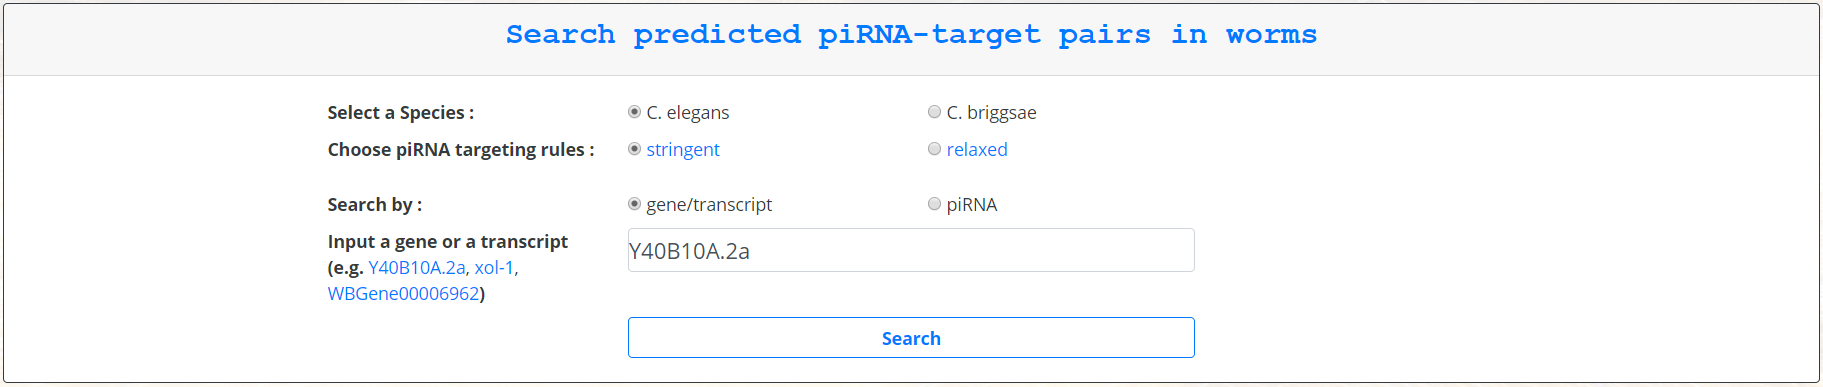
piRTarBase supports querying either by gene or by piRNA. The user can select either the desired species (currently C.elegans or C.briggsae), the desired stringency of the targeting rules, and whether the input will be a gene/transcript name or a piRNA name.
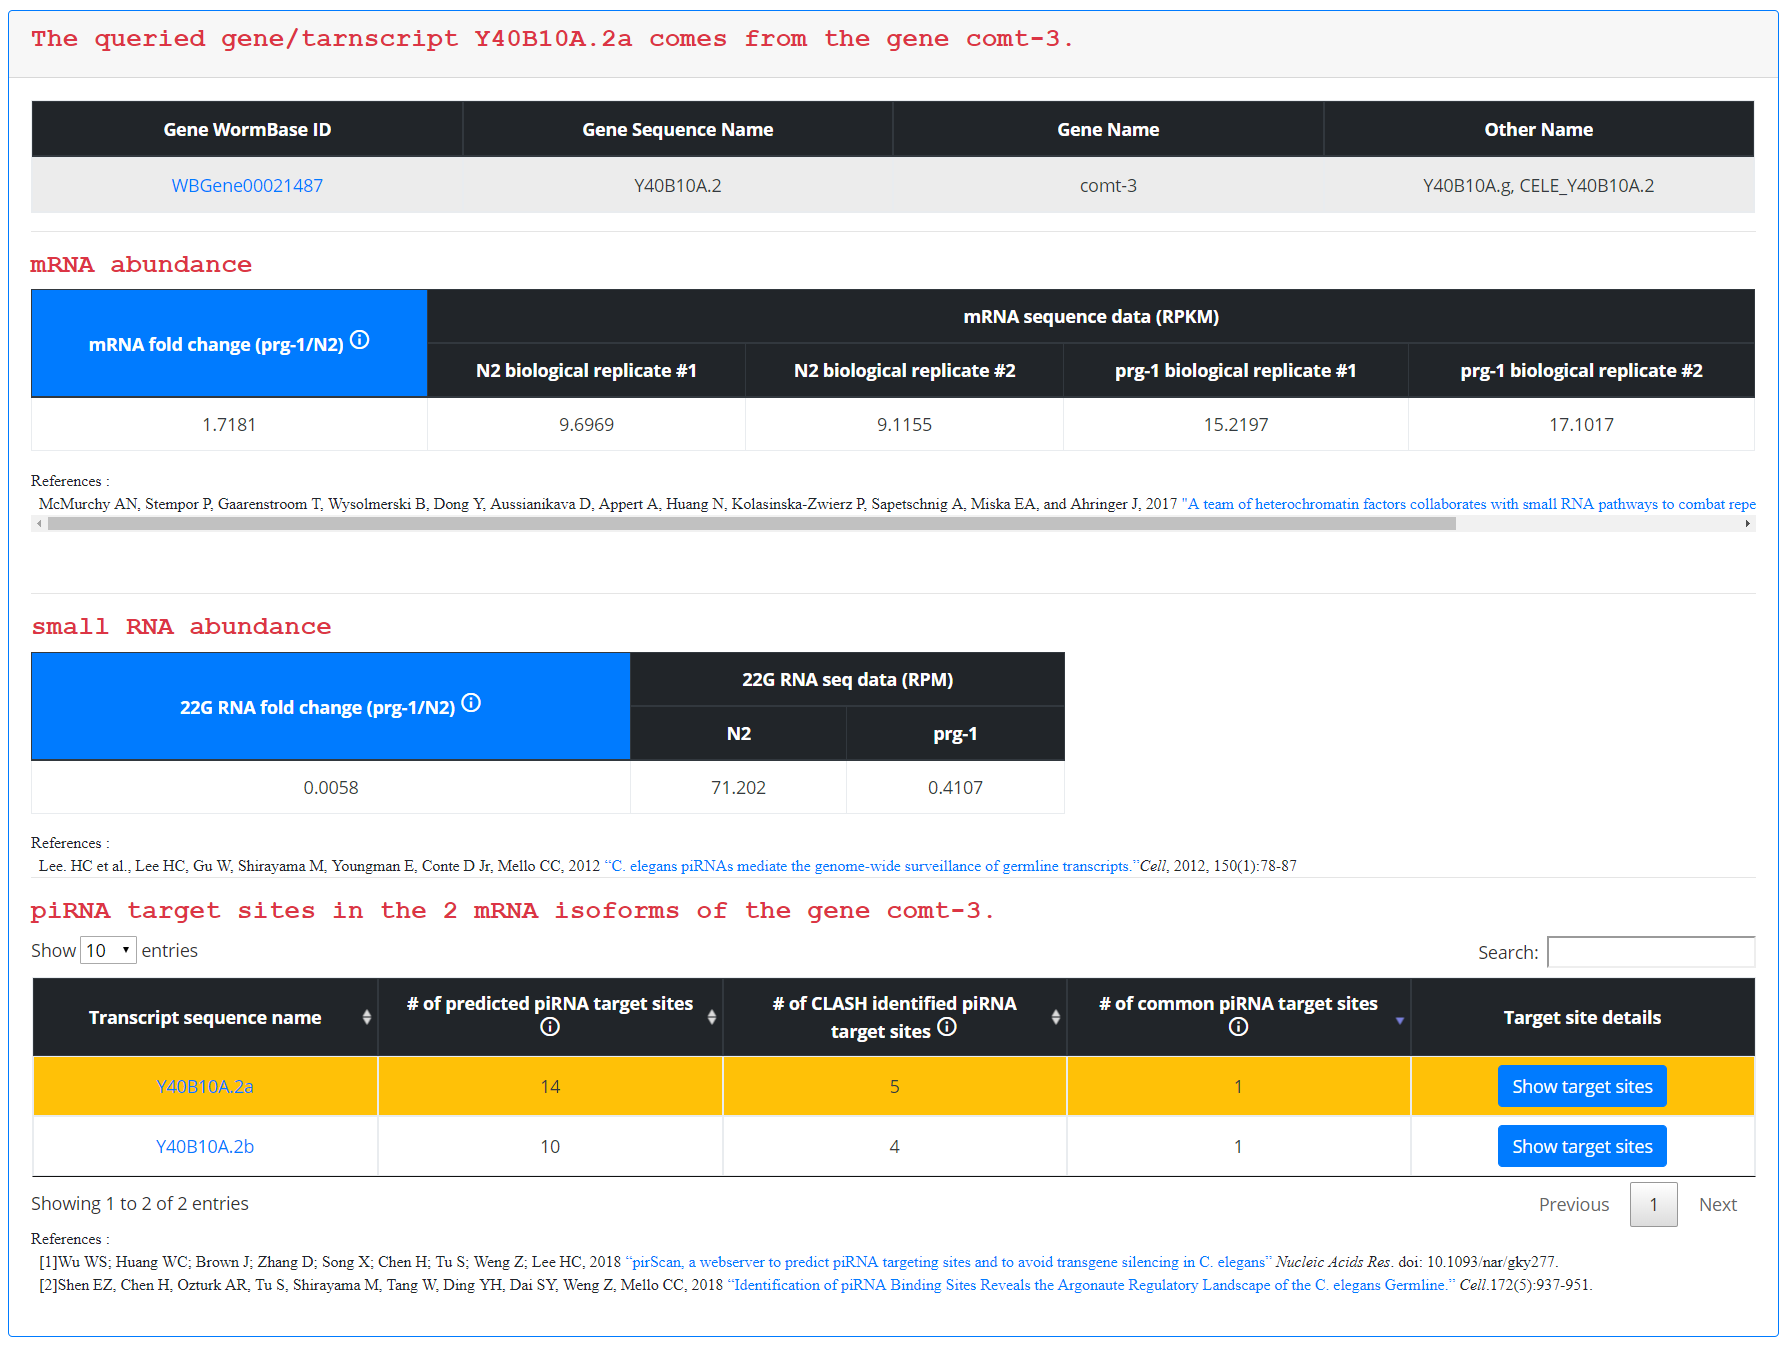
For gene/transcript querying, clicking search following input of the gene/transcript name results in a table displaying the queried terms, a table displaying mRNA and small RNA expression data, and a table displaying isoform-specific piRNA targeting site information. In the mRNA expression data, expression levels for the input gene are displayed in reads per kilobase million (RPKM) for wildtype animals and PIWI mutant animals, with two biological replicates for each strain. This information is summarized for the user in a mRNA fold change field, which calculates the average mRNA fold change in PIWI mutants relative to wildtype animals. The user can use this field to determine whether loss of PIWI results in an elevated level of expression (fold change > 1) or a reduced level of expression (fold change < 1). Additionally, 22G siRNA RNA sequencing data is available in reads per million (RPM) for wildtype and PIWI mutant animals. The 22G RNA fold change is displayed in a field, which will allow the user to determine whether loss of PIWI results in a reduction of 22G siRNAs mapping to that gene (fold change <1) or an accumulation of 22G siRNAs mapping to that gene (fold change >1). The last table on the page displays the different mRNA isoforms that exist for the queried gene and the piRNA targeting sites that exist for each. Targeting sites are grouped into three categories: targeting sites predicted by pirScan’s algorithm, targeting sites predicted by CLASH data, and targeting sites that were predicted by both pirScan and CLASH data. Additional information about each identified targeting site can be found by clicking “Show target sites”.
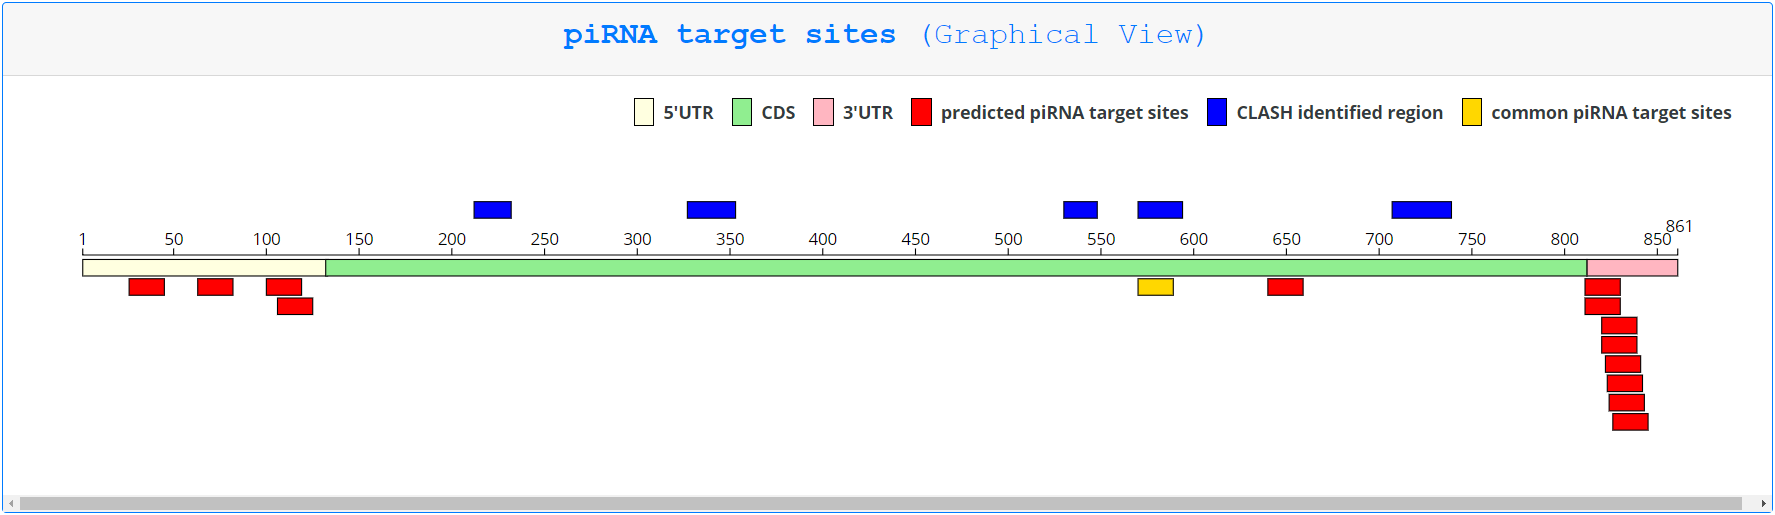
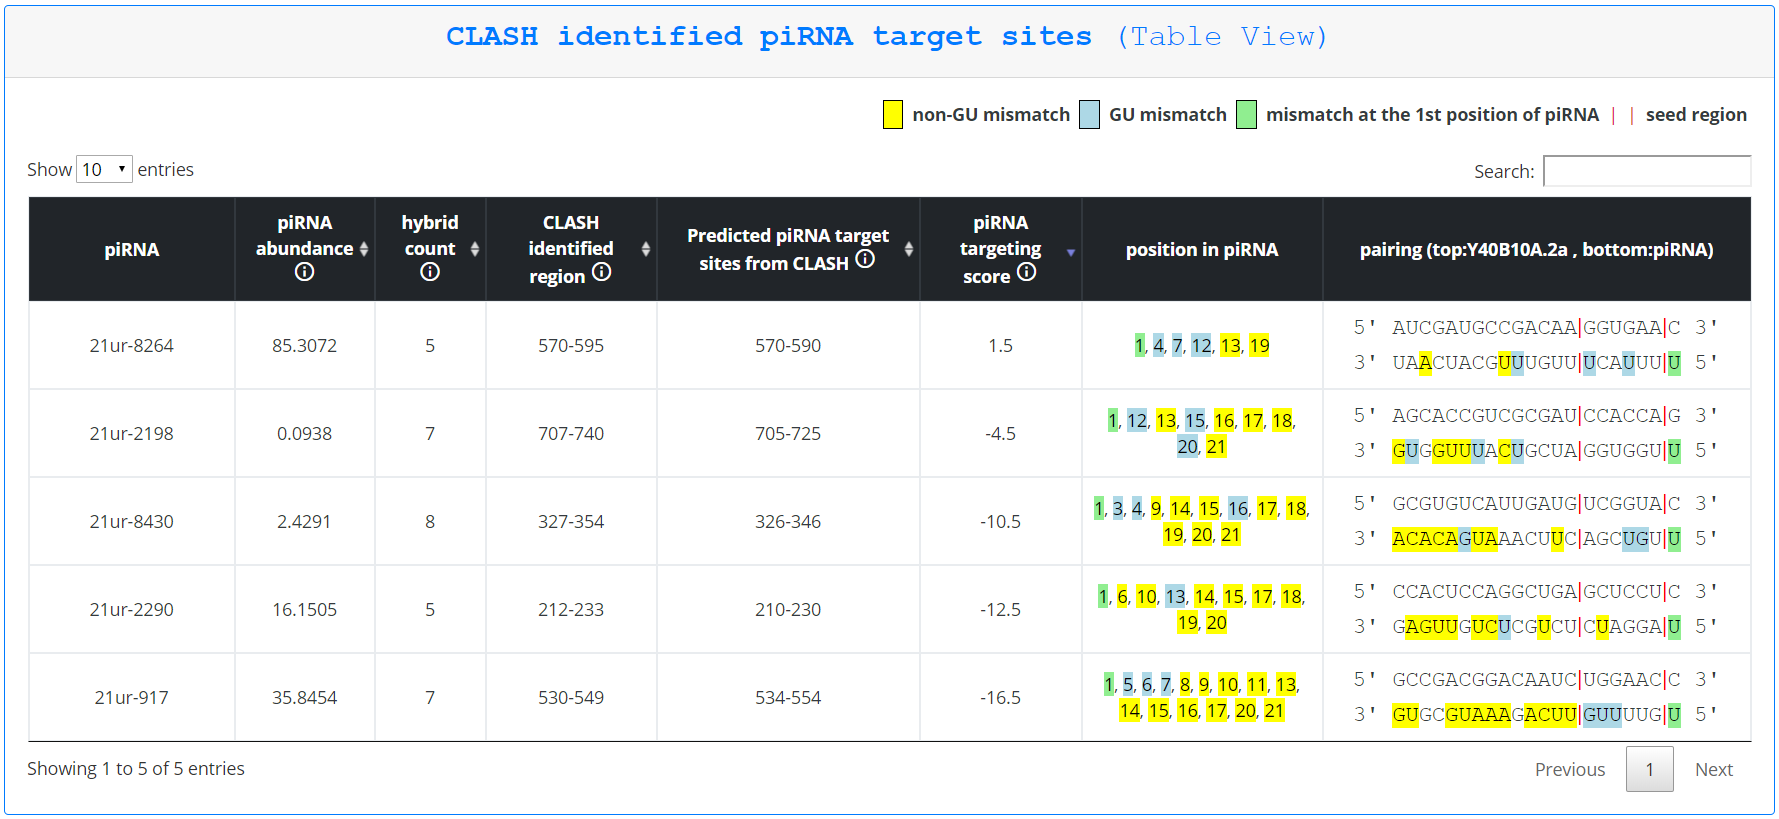
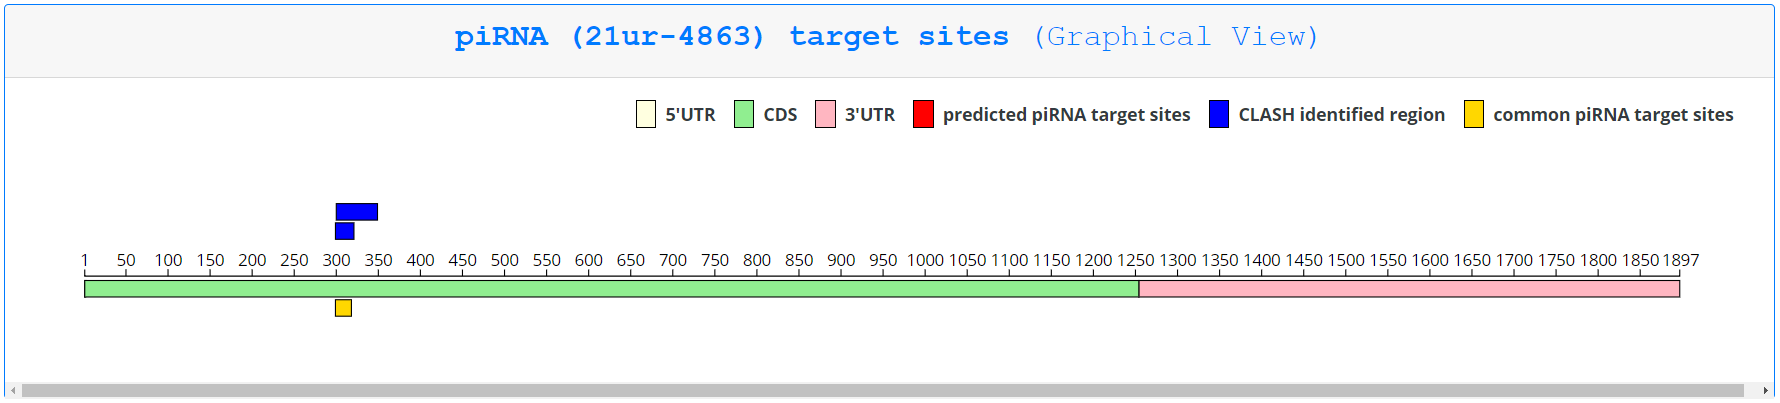
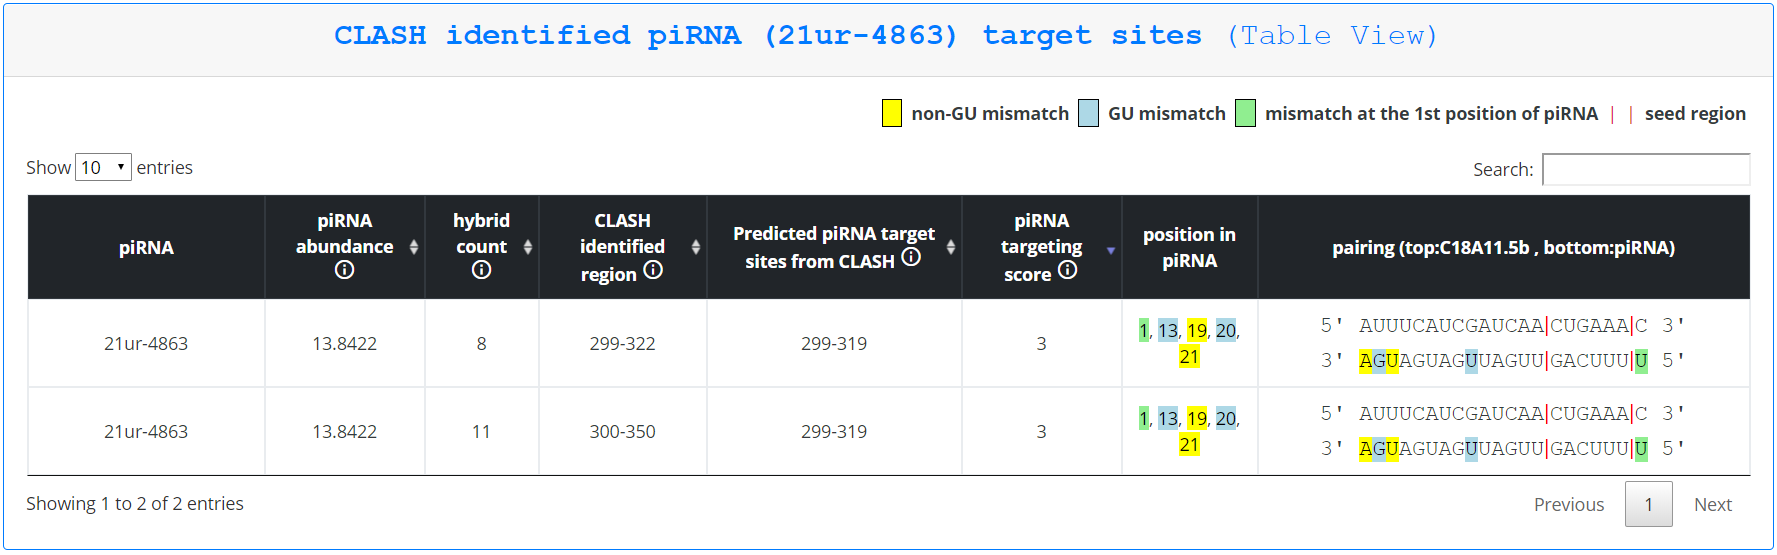
On this page, piRNA targeting sites are first displayed as a graphic, with only pirScan predicted targeting sites in red, CLASH identified regions in blue, and sites identified by both methods in yellow. Tables corresponding to each type of identified targeting site follow. Hovering over any displayed targeting site gives the user additional information about that site, including which piRNA is being displayed, the expression level of that piRNA, the number of hybrids sequenced (if the piRNA was predicted by CLASH), the region targeted in the mRNA identified in the chimera and the predicted pairing region (for sites predicted by CLASH), the region targeted in the mRNA according to pirScan’s prediction, the piRNA targeting score, the mismatches between the piRNA and the targeted site, and the predicted pairing of the piRNA to the targeted site. This information is additionally displayed in the tables that follow the graphic.
Search by piRNA
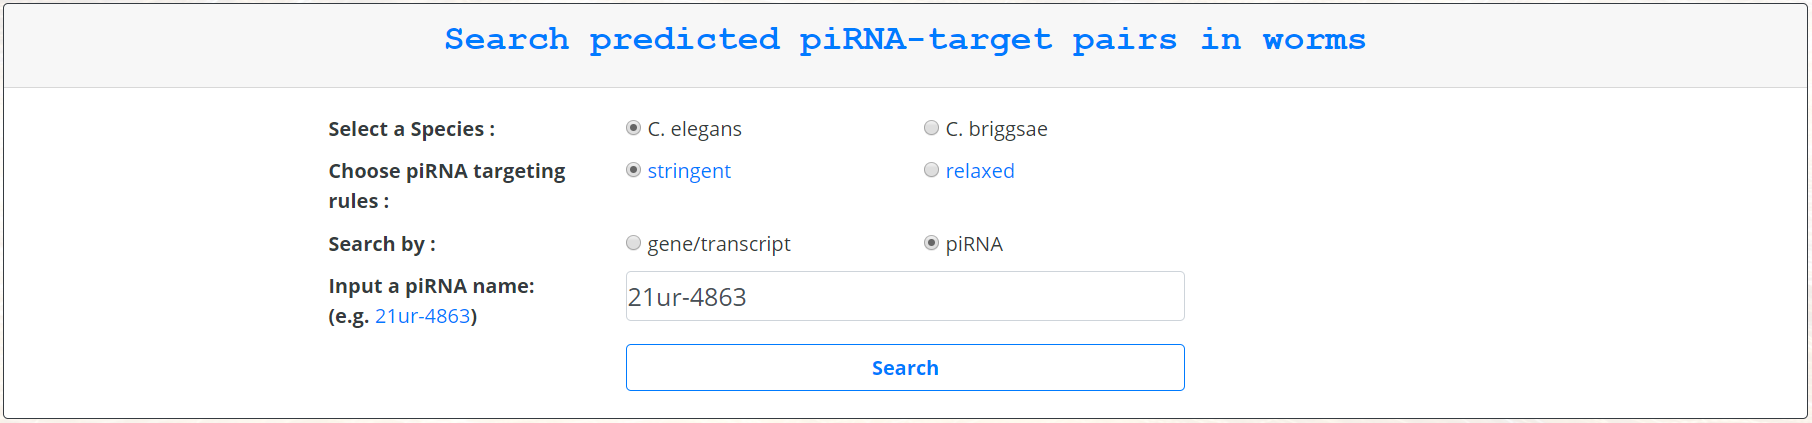
For querying by piRNA, the user can input a piRNA name and click search.
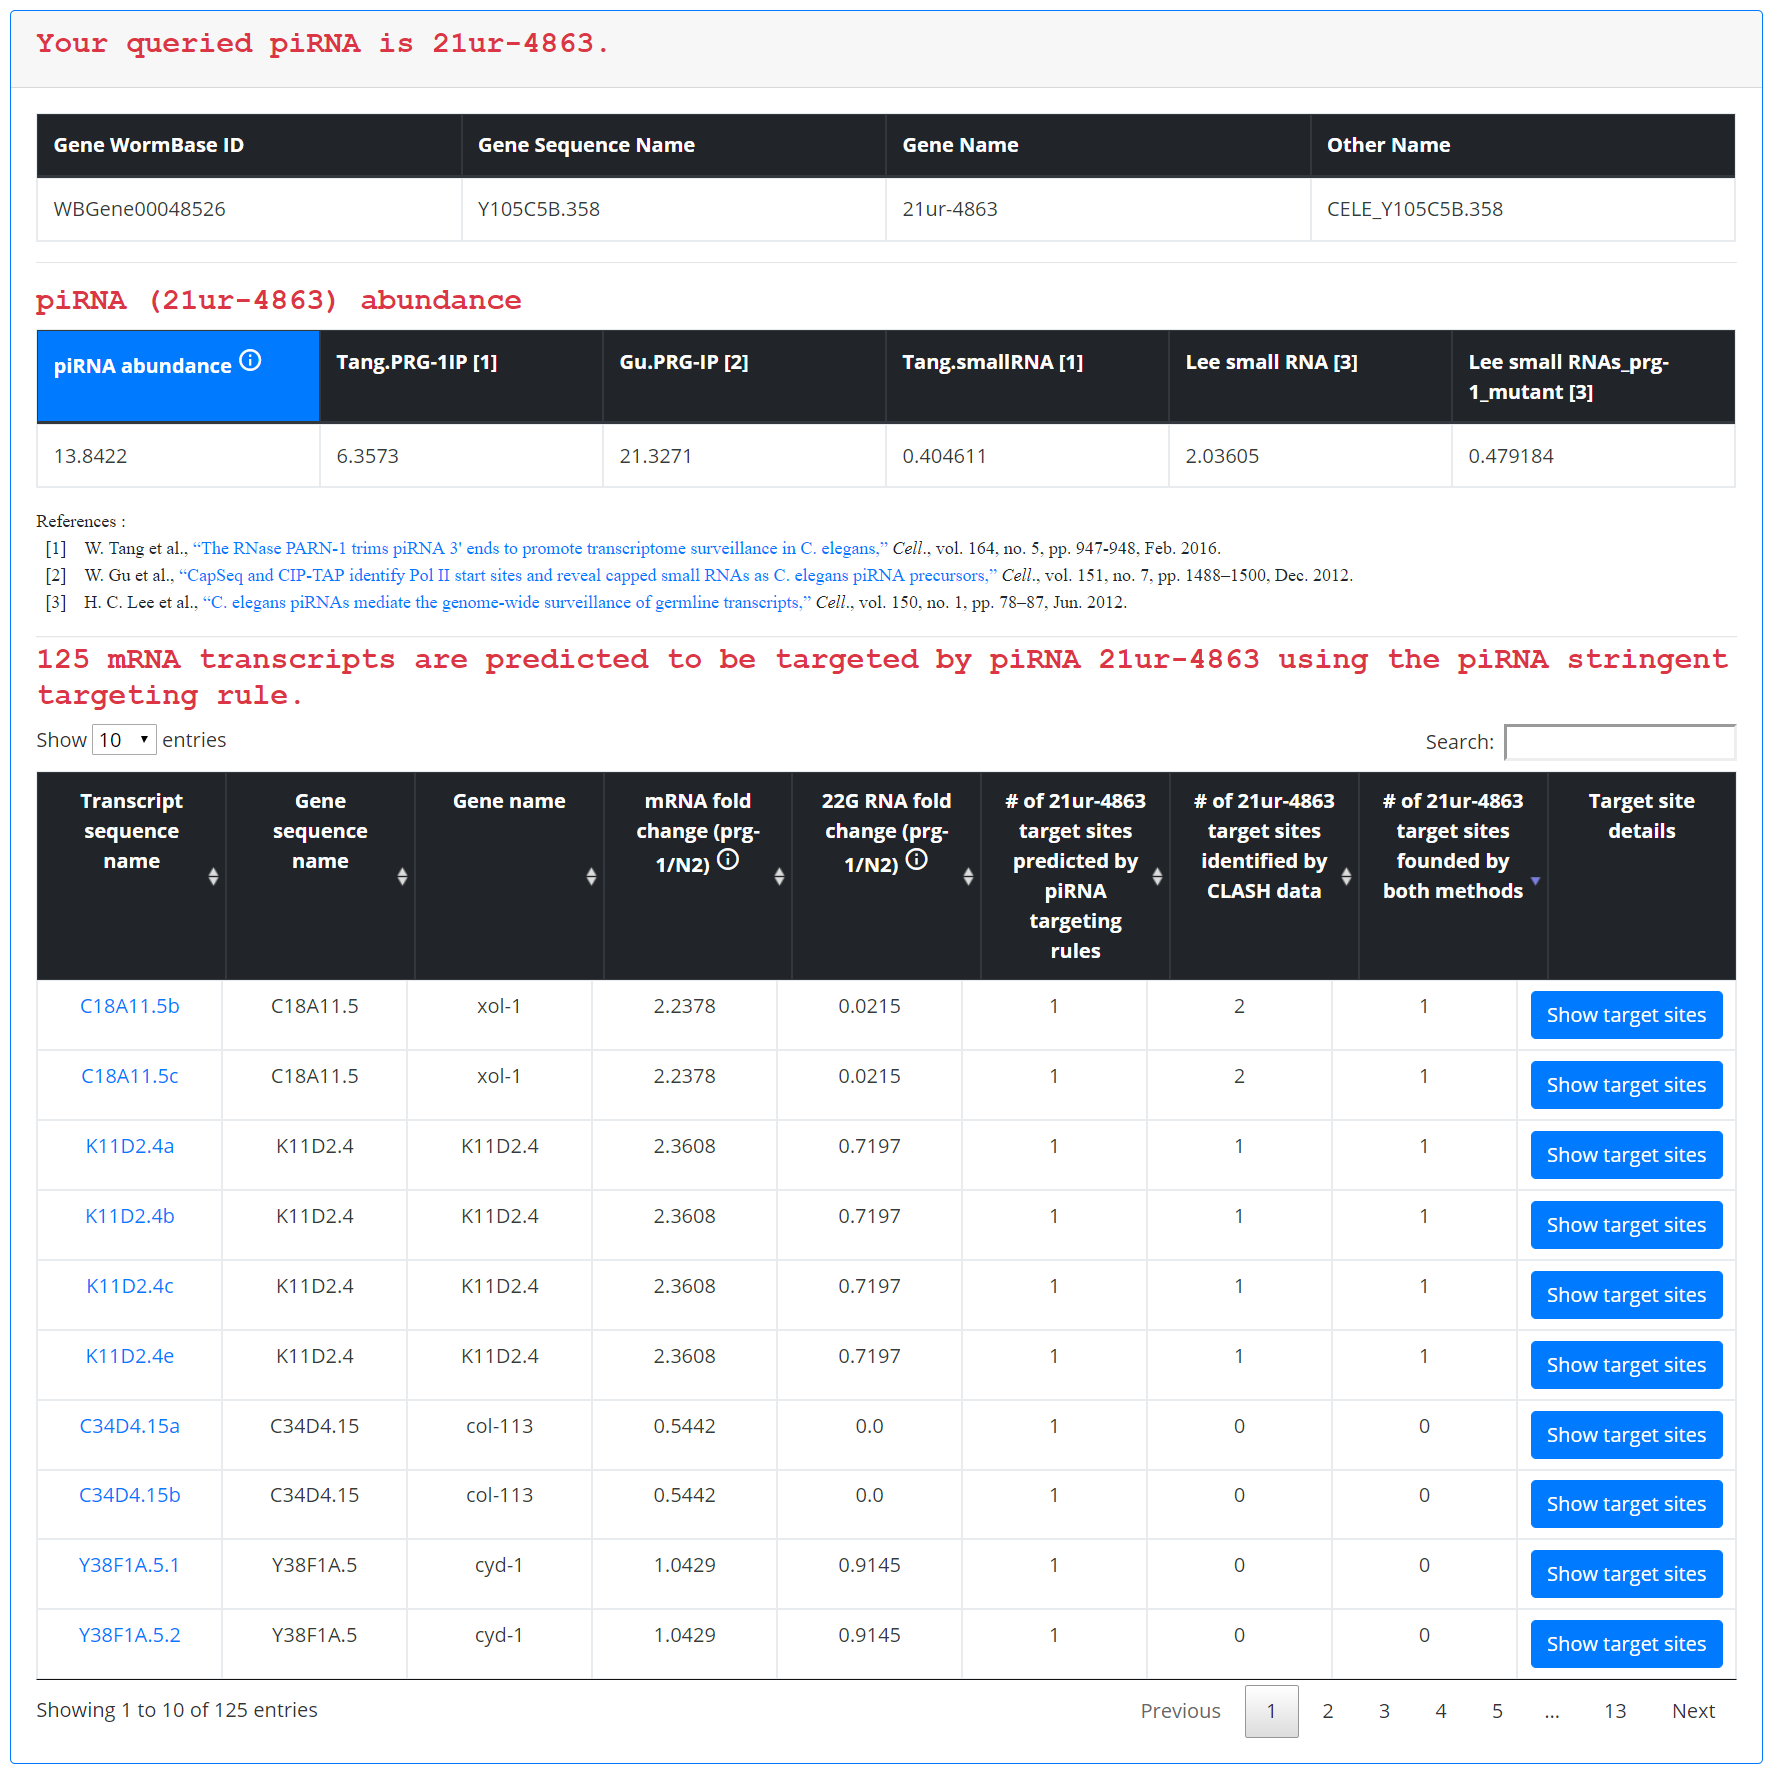
The average piRNA expression data displayed in this case corresponds to the expression of that piRNA as determined by PIWI IP sequencing and small RNA sequencing studies. All mRNA targets are displayed in a single table, with each row containing all of the information outlined above for querying by gene, including mRNA and small RNA expression fold changes and numbers of target sites predicted for that particular piRNA on a given gene.
To find more information about the piRNA-mRNA information displayed in each row, the user can click ‘Show target sites’ to open an analogous page as described for querying by gene, except only targeting sites involving the queried piRNA are displayed.
Browse all genes and piRNAs
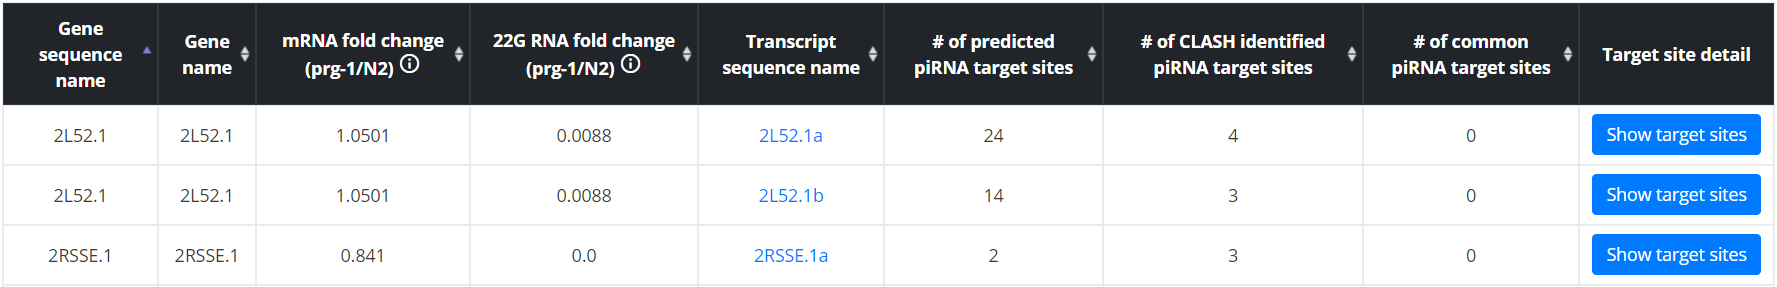
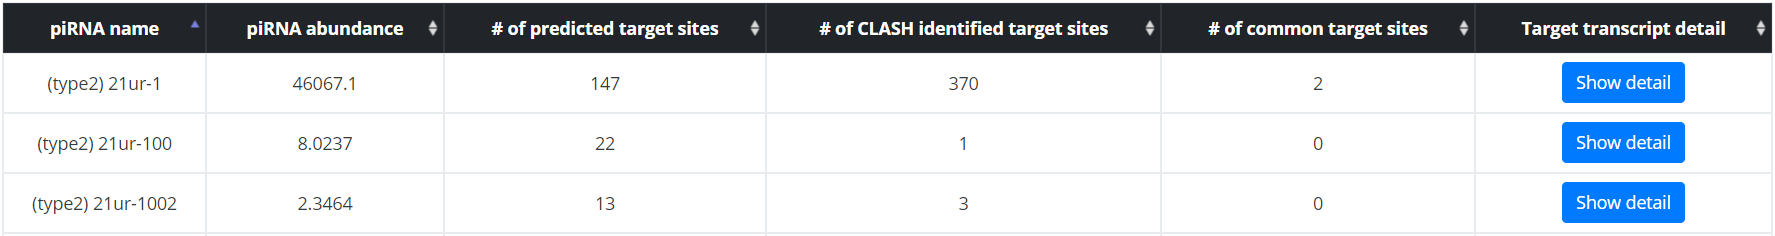
All transcripts or piRNAs can be displayed in a single sortable table. Browsing by transcript will allow users to find the mRNA and 22G RNA fold change information and the piRNA targeting site information, and to access the target site specific pages for each transcript. Browsing by piRNA will allow users to find expression information for each piRNA and mRNA targets predicted for each piRNA, and to access the target site specific pages for each target of the queried piRNA. Row can be sorted by any fields, allowing users to identify which mRNA transcripts contain most target sites, or whose expression is most affected by loss of PIWI for example.
Download piRTarBase content
All data contained in piRTarBase is available for download for advanced analyses, if necessary.