YGMD
Yeast Gene Module Database
(An enhanced version of YCRD)
About YGMD
Usage of YGMD
Motivation of YGMD
In response to internal or external stimuli, a living cell would coordinately express a set of functionally related genes, termed a gene module (GM). The transcriptional regulation of the spatio-temporal expression pattern of a GM is usually controlled by a cooperative transcription factor set (CoopTFS) consisting of several cooperative transcription factors. Therefore, identifying CoopTFSs and their target GMs is important for understanding cellular responses to environmental changes.
Computational approaches have been developed to predict cooperative transcription factor pairs or GMs in Saccharomyces cerevisiae. On the other hand, two yeast databases have been constructed by collecting transcription factors (TFs) and their target GMs with experimental evidence from the literature. First, YEASTRACT collects 307 GMs, each of which is regulated by a single TF. The regulatory associations between a TF and its target GM are supported by experimental evidence in the literature. Second, YCRD collects 2535 GMs, each of which is regulated by a predicted cooperative TF pair. The regulatory associations between a predicted cooperative TF pair and its target GM are supported by experimental evidence in the literature.
Note that YEASTACT only provides GMs regulated by a single TF and YCRD only provides GMs regulated by a predicted cooperative TF pair. Considering only one or two TFs is a limitation of these two databases because biologists have demonstrated that more than two TFs could form a complex to co-regulate a GM. For example, Fkh2-Mcm1-Ndd1 complex regulates a GM expressed in the G2/M phase of the cell cycle, Cbf1-Met4-Met32 complex regulates a GM involved in the sulfur metabolism and Hap2-Hap3-Hap4-Hap5 complex regulates a GM involved in the respiratory process. Therefore, it is advantageous to have a database to provide CoopTFSs, each of which may consist of more than two cooperative TFs, and their target GMs.
What is YGMD?
To meet this need, we construct YGMD (Yeast Gene Module Database) to provide 34120 GMs, each of which is regulated by a CoopTFS consisting of two to five cooperative TFs. The cooperativity between TFs in a CoopTFS is suggested by physical/genetic interaction evidence or/and predicted by existing algorithms. The target GM regulated by a CoopTFS is defined as the common target genes of all the TFs in a CoopTFS. The regulatory association between any TF in a CoopTFS and any gene in the target GM is supported by only TFB evidence or both TFB&TFR evidence. TFB evidence means the experimental evidence showing that a TF binds to the promoter of its target gene. TFR evidence means the experimental evidence showing that a perturbation (knockout or over-expression) of a TF significantly change the expression of its target gene. We believe that YGMD will be a valuable resource for yeast biologists to study the underlying molecular mechanisms of cellular responses to environmental changes.
Data collection
Seven types of data were used to construct YGMD.
- The target genes of 201 TFs (validated by TFB evidence) and the target genes of 160 TFs (validated by both TFB evidence and TFR evidence) were downloaded from YEASTRACT. TFB evidence is the experimental evidence (from ChIP assay, foot-printing or band-shift) showing that a TF binds to the promoters of its target genes. TFR evidence is the experimental evidence (from genome-wide expression analysis or detailed gene by gene analysis) showing that a TF perturbation (over-expression or knockout) causes a significant change in the expression of its target genes.
- The physical interaction and genetic interaction data of all yeast genes were downloaded from BioGRID.
- 2622 predicted cooperative TF pairs (collected from 17 existing algorithms) were downloaded from CoopTFD.
- Nine kinds of associations between 695005 yeast gene-gene pairs were downloaded from YeastNet. The associations include co-citation, co-expression, co-occurrence of protein domains, similar genomic context of bacterial orthologs, similar profiles of genetic interaction partners, high-throughput protein-protein interactions, small/medium-scale protein-protein interactions, similar phylogenetic profiles, and 3-D protein structure of interacting orthologous proteins.
- The last three types of data (Gene Ontology (GO) terms, literature data and biochemical pathway data) for all yeast genes were downloaded from SGD.
Construction of CoopTFSs
In YGMD, we constructed CoopTFSs, each of which consists of two to five TFs. Here we illustrate the procedure of constructing all possible CoopTFSs of four TFs as an example.
- Use all the TFs in YEASTRACT to enumerate all possible TF sets of four TFs.
- Construct a corresponding 4-node network for each TF set of four TFs. In this network, two nodes (i.e. TFs) have an edge if they have physical interaction, genetic interaction (according to BioGRID) or predicted cooperativity by existing algorithms (according to CoopTFD).
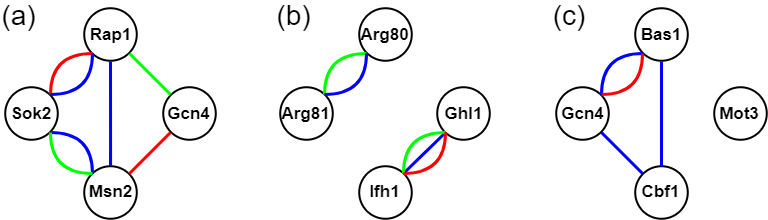
- A TF set is called a CoopTFS if the corresponding 4-node network has only one connected component. That is, any two nodes in the network are connected to each other by paths. Our rationale is that any two TFs in a CoopTFS should have direct (i.e. connected by an edge) or at least indirect (i.e. connected by a path) cooperativity. The direct cooperativity between two TFs is suggested by physical/genetic interaction evidence or/and predicted by existing algorithms. Here we give three examples to clarify the concept. As shown in the following figure, The TF set {Gcn4, Msn2, Rap1, Sok2} is a CoopTFS but the TF sets {Arg80, Arg81, Ifh1, Ghl1} and {Bas1, Cbf1, Gcn4, Mot3} are not.
Construction of the target GM of a CoopTFS
The target GM regulated by a CoopTFS is defined as the common target genes of all the TFs in a CoopTFS. Two kinds of GMs could be defined.
- For the first kind of GM, the regulatory association between any TF in a CoopTFS and any gene in the target GM is supported by TFB&TFR evidence meaning that (i) the TF binds the promoter of its target gene and (ii) the TF perturbation (over-expression or knockout) causes a significant change in the expression of its target gene.
- For the second kind of GM, the regulatory association between any TF in a CoopTFS and any gene in the target GM is only supported by TFB evidence meaning that the TF binds the promoter of its target gene.
| # of CoopTFSs of 2 TFs | # of CoopTFSs of 3 TFs | # of CoopTFSs of 4 TFs | # of CoopTFSs of 5 TFs | Total # of CoopTFSs | |
|---|---|---|---|---|---|
| Regulatory association validated by TFB&TFR evidence | 346 | 446 | 253 | 51 | 1096 |
| Regulatory association validated by TFB evidence | 1188 | 4629 | 10550 | 16657 | 33024 |
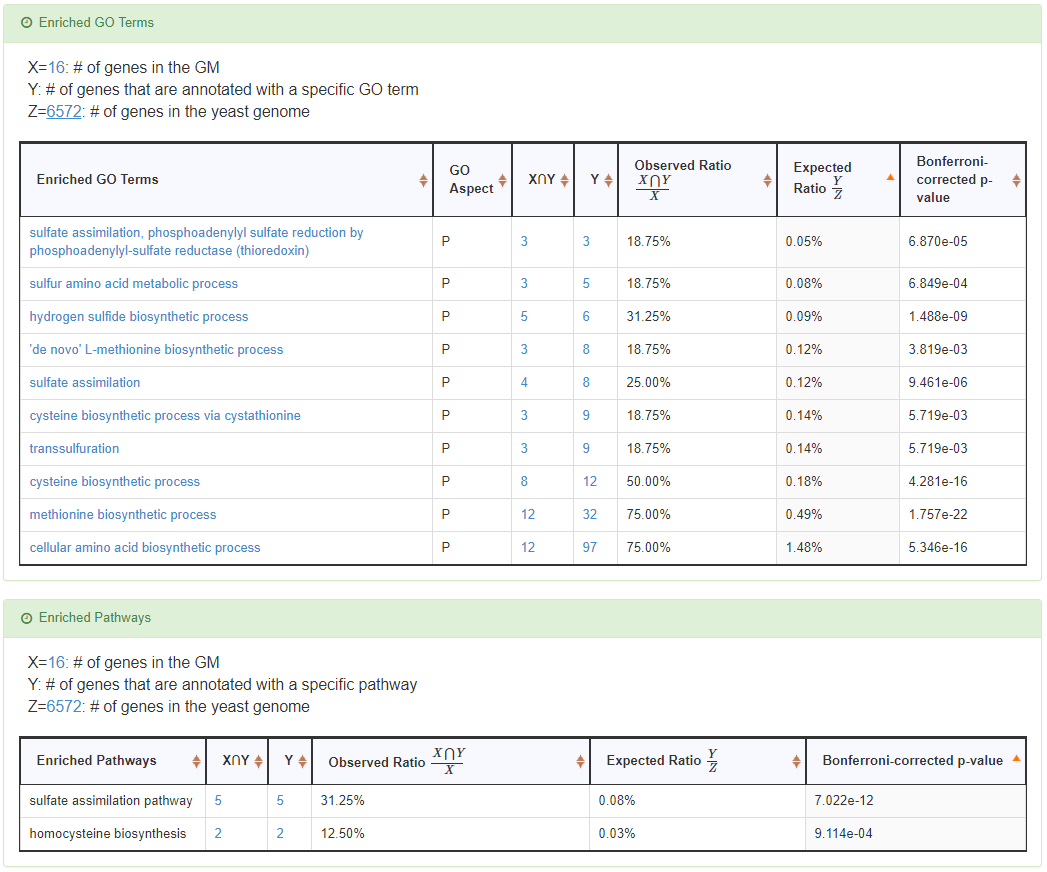
Identification of the enriched GO terms and pathways of a GM
For each GM, YGMD provides a tool to identify the enriched GO terms and pathways. The hypergeometric distribution is used to test the statistical significance of enrichment. The procedures for checking whether a specific GO term is enriched in a given GM is as follows. Let S be the set of genes which are annotated to that specific GO term, R be the set of genes of a given GM, T=S∩R be the set of genes which are annotated to that specific GO term and are also in the given GM, and F be the set of all genes in the yeast genome. Then the p-value for rejecting the null hypothesis (H0: the specific GO term is not enriched in the given GM) is calculated as
where |S| means the number of genes in set S. This p-value is then corrected by the Bonferroni correction to represent the true alpha level in the multiple hypotheses testing. A specific GO term is said to be enriched in the given GM if the Bonferroni-corrected p-value is less than 0.01. Note that the procedure for checking whether a specific pathway is enriched in a given GM is the same as above-mentioned procedure.
$P_{value} = P(x\geq \left | T \right |) \ = \sum_{x\geq \left | T \right |} \limits {}\frac{\binom{\left | S \right |}{x}\binom{\left | F \right |-\left | S \right |}{\left | R \right |-x}}{\binom{\left | F \right |}{\left | R \right |}}$
Implementation of the web interface of YGMD
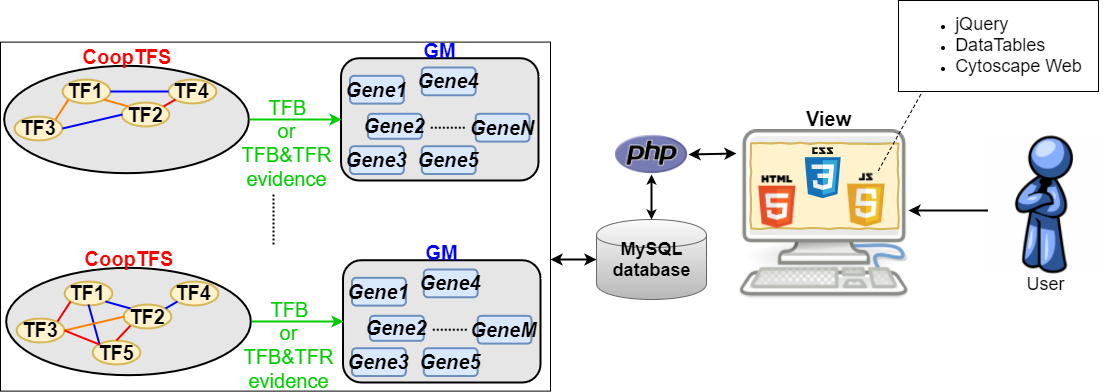
Database interface
First Search Mode:
In the first search mode (i.e. Search by a CoopTFS name), users have to select three settings: a CoopTFS of interest, the experimental evidence (TFB or TFB&TFR) of the regulatory associations, and a least number of genes that a GM must contain.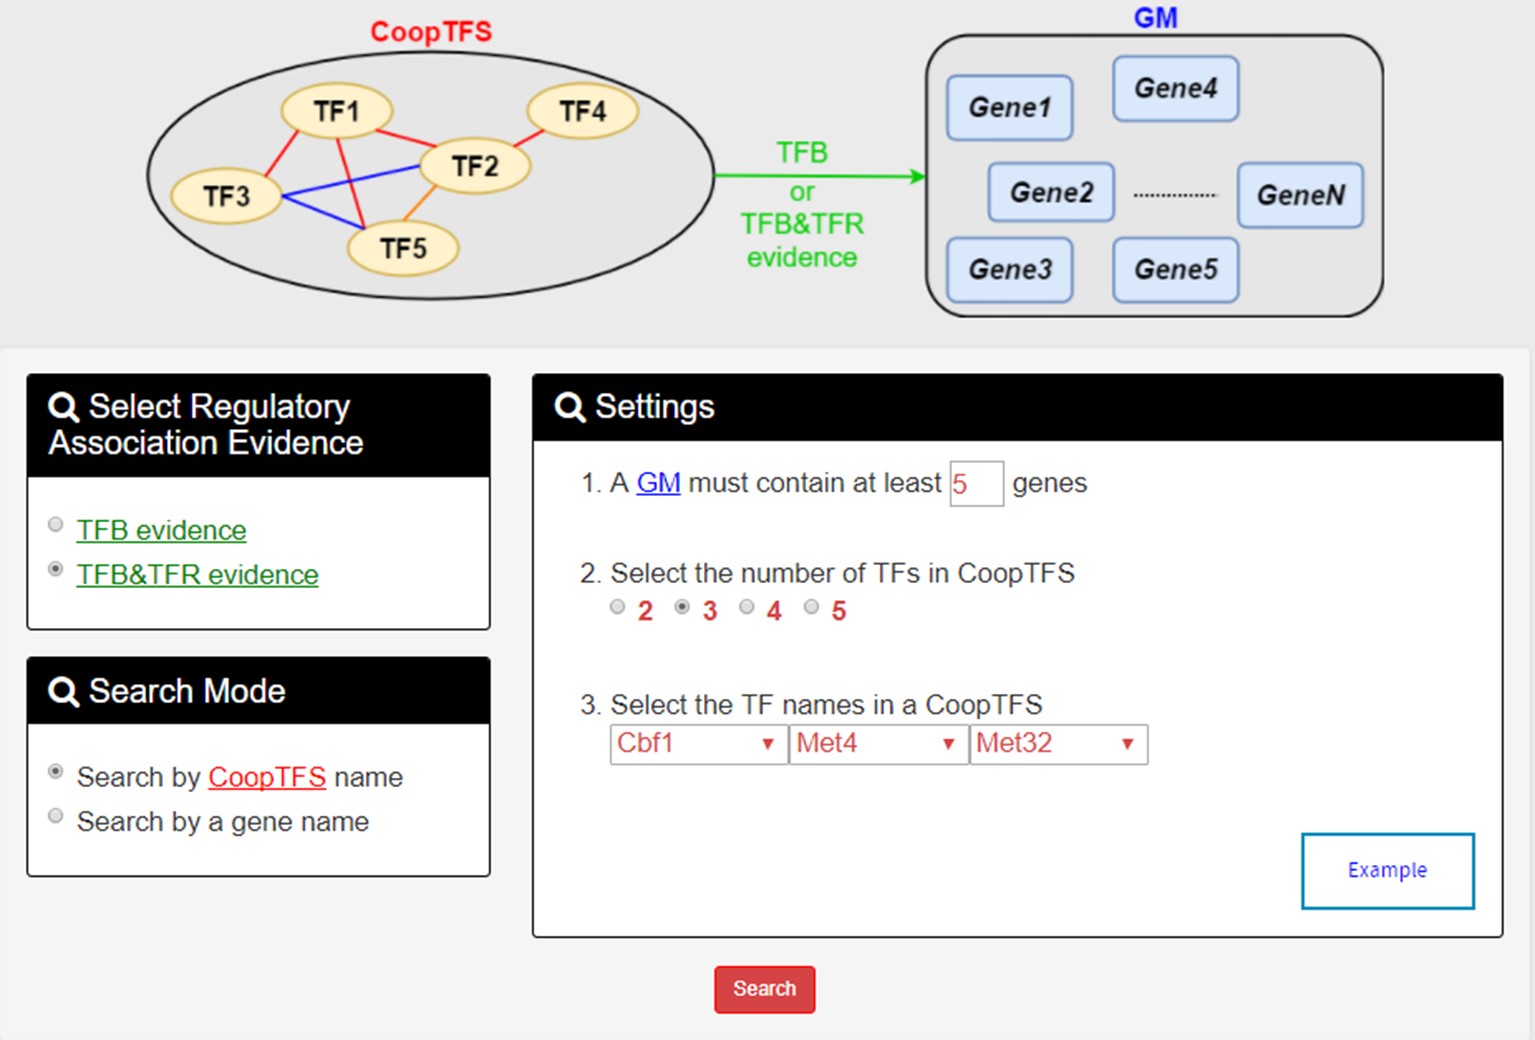
After submission, YGMD returns a result page of five parts:
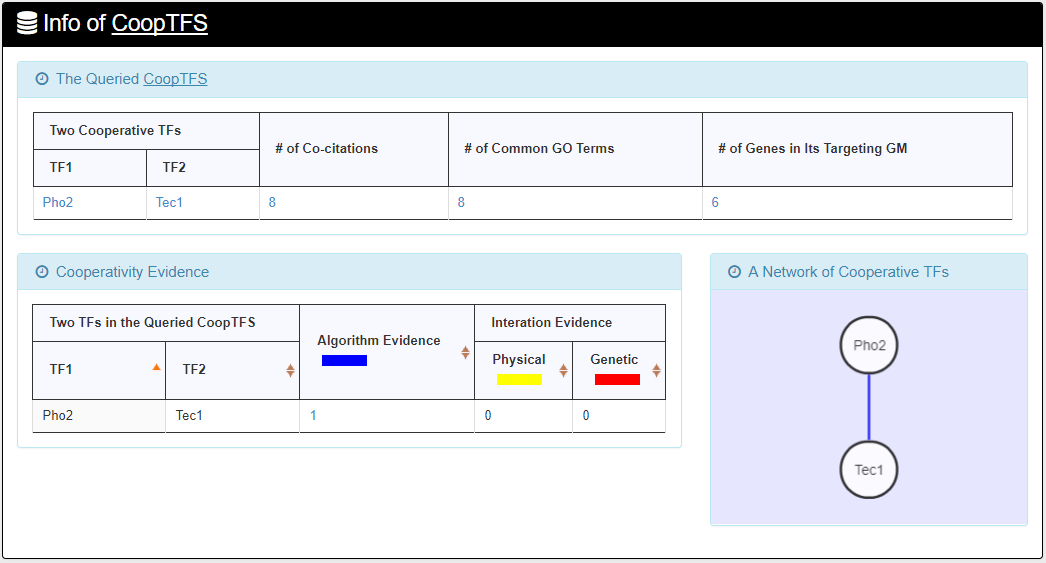
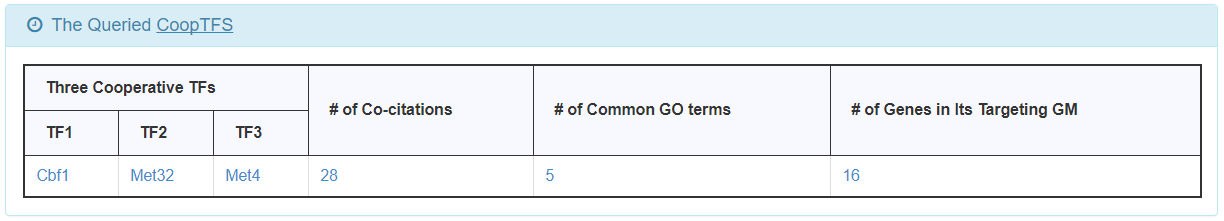
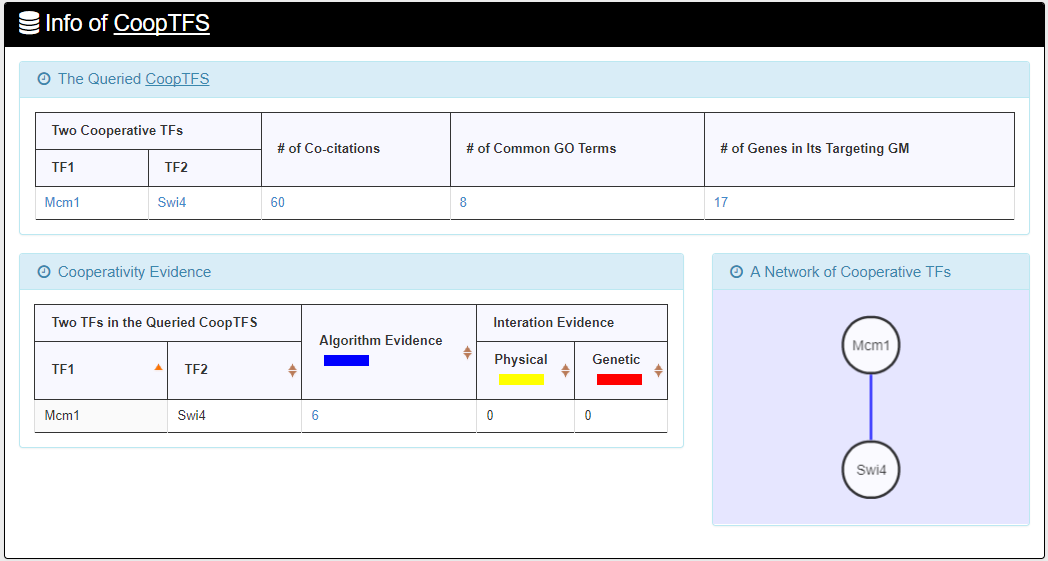
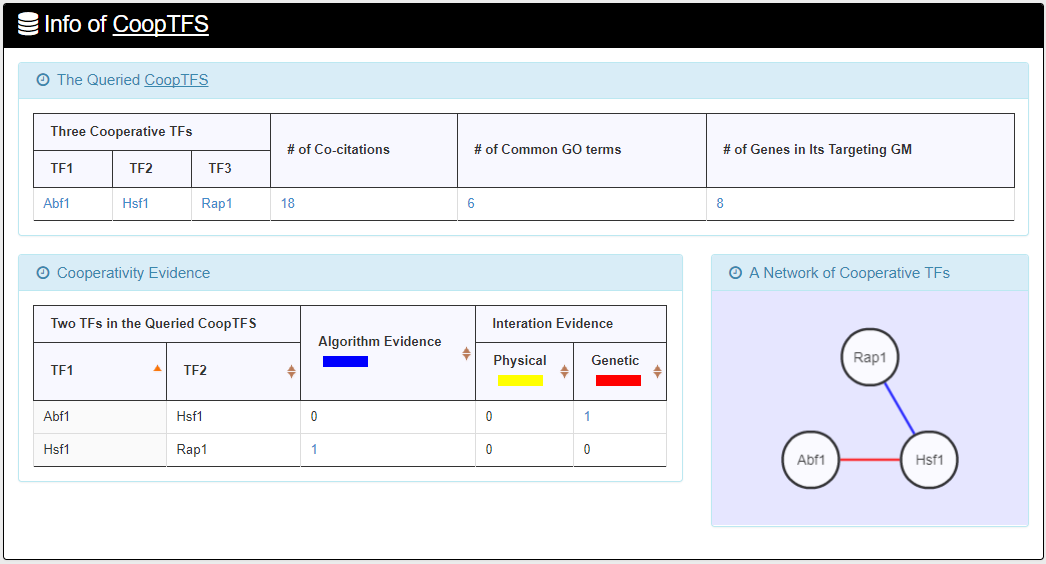
- For the chosen CoopTFS, YGMD provides the names of the TFs, the number of co-citations of these TFs, the number of common GO terms of these TFs, and the number of genes in its target GM. Note that if a CoopTFS is of biological relevance, we expect to see many co-citations and common GO terms.
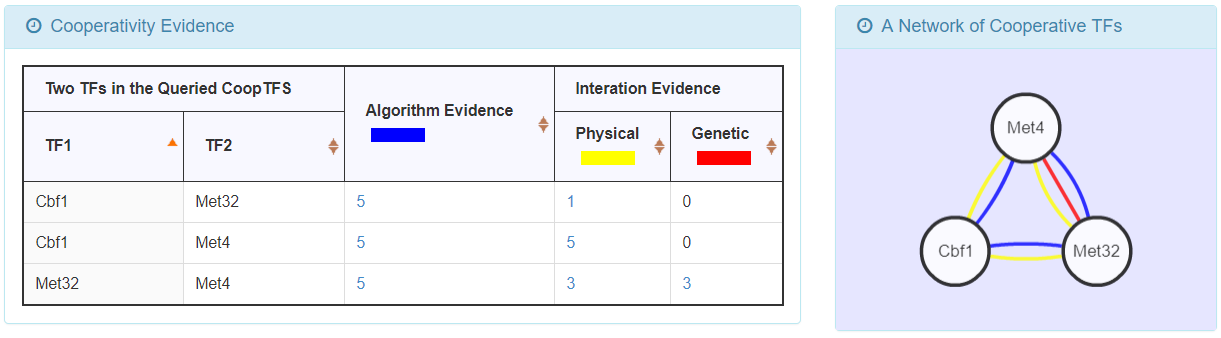
- A cooperative TF network for the chosen CoopTFS is constructed. An edge between two TFs exists if these two TFs have physical interaction, genetic interaction or predicted cooperativity by existing algorithms. Note that if a CoopTFS is of biological relevance, we expect to see many edges in the network.
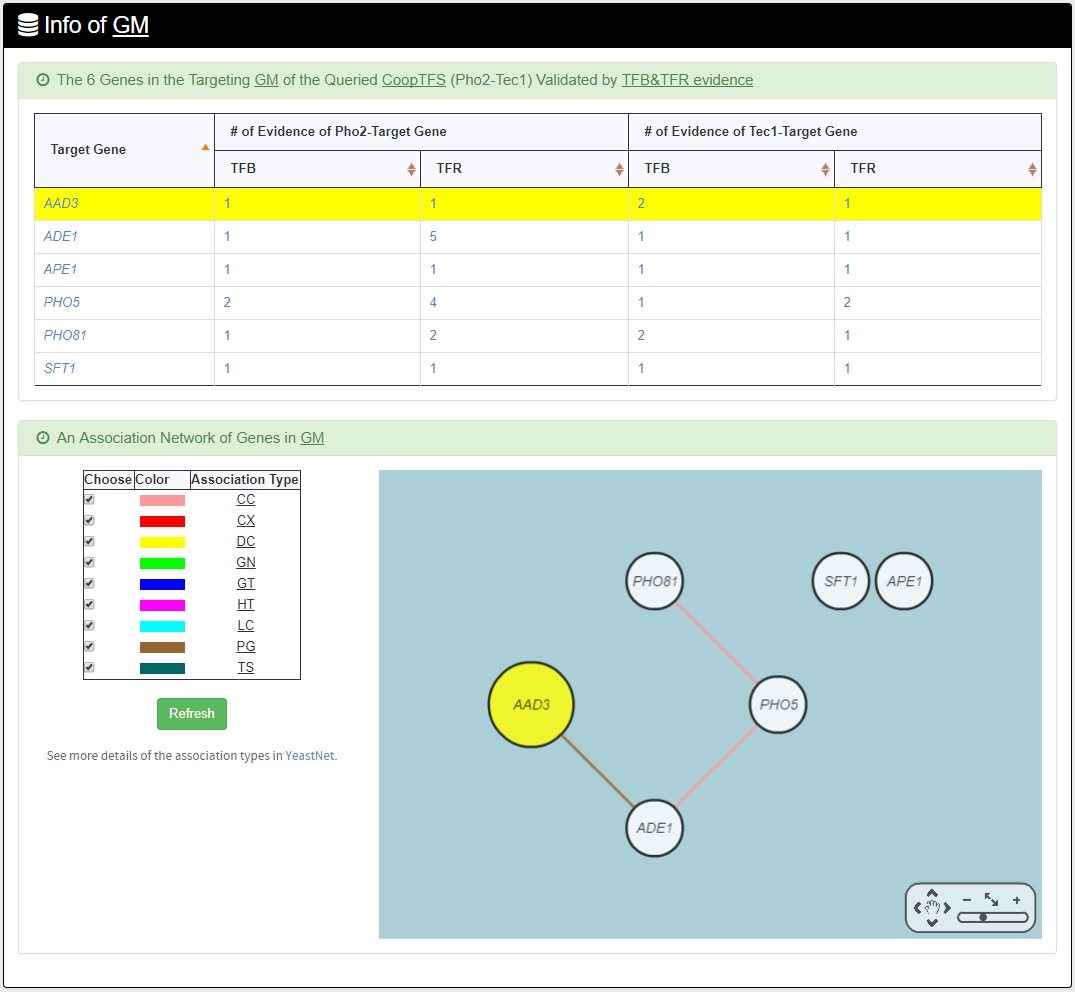
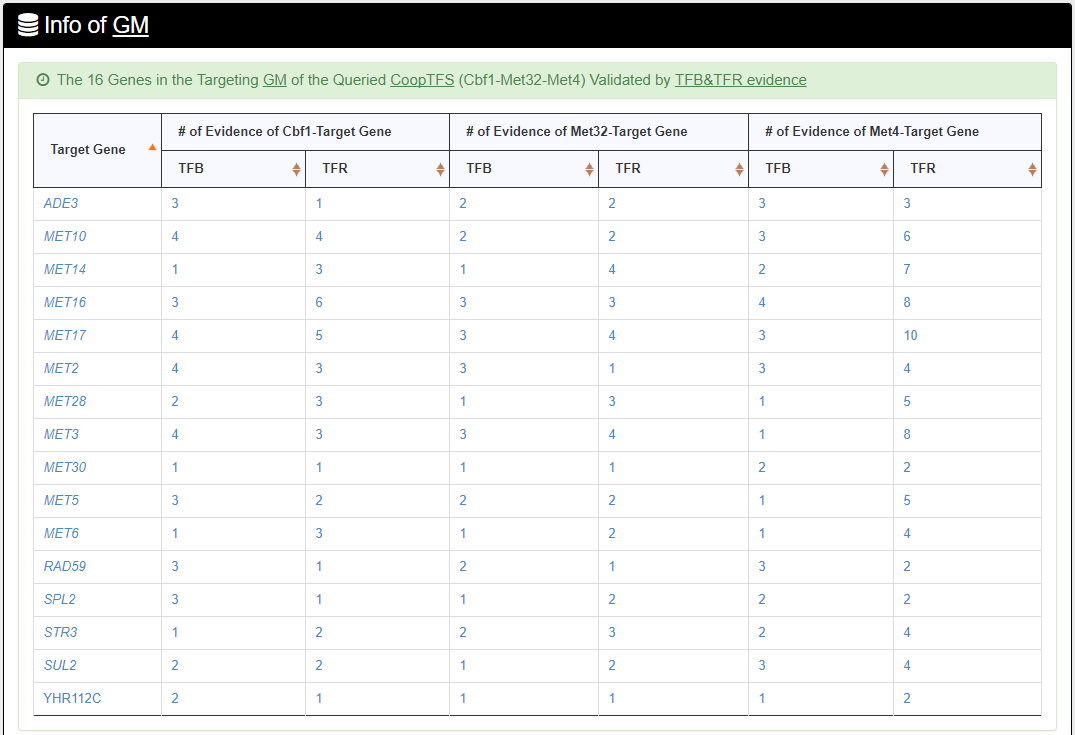
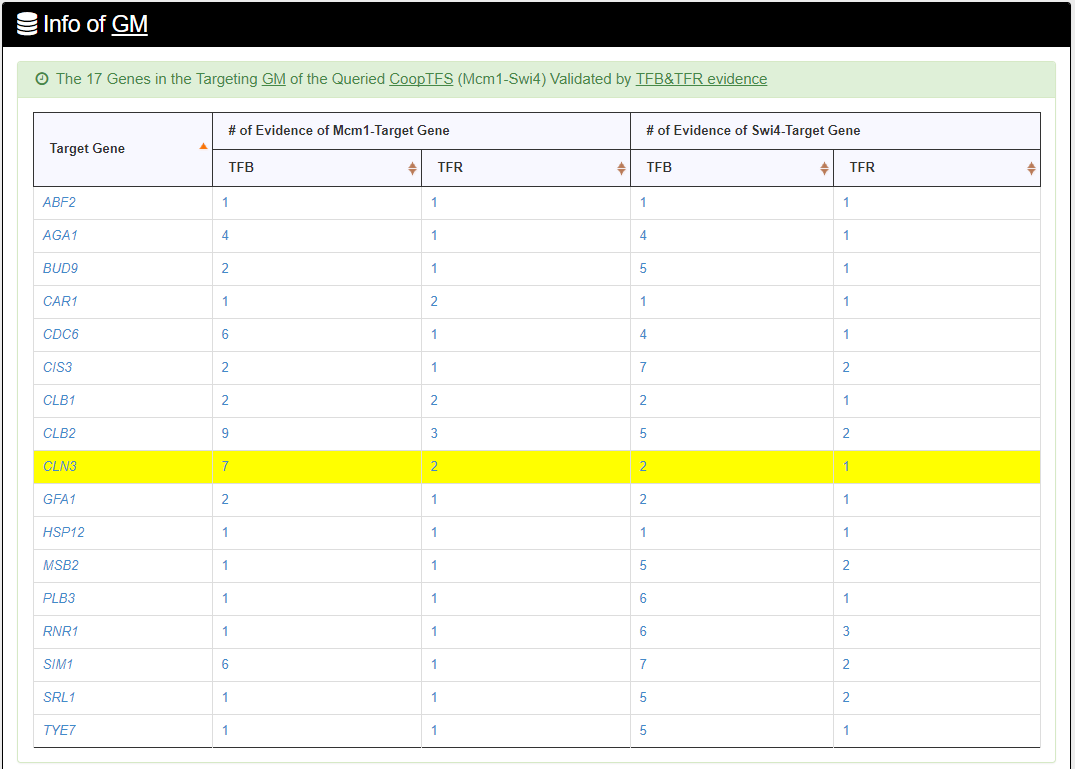
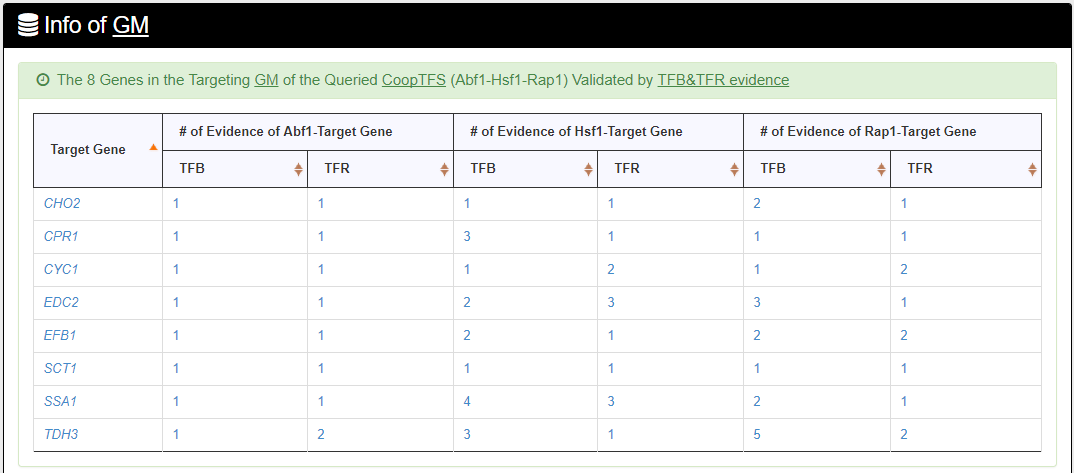
- The names of genes in the target GM and the number of experimental evidence of the regulatory association between any TF in the CoopTFS and any gene in its target GM are given. Note that the regulatory association of every TF-gene pair has literature evidence.
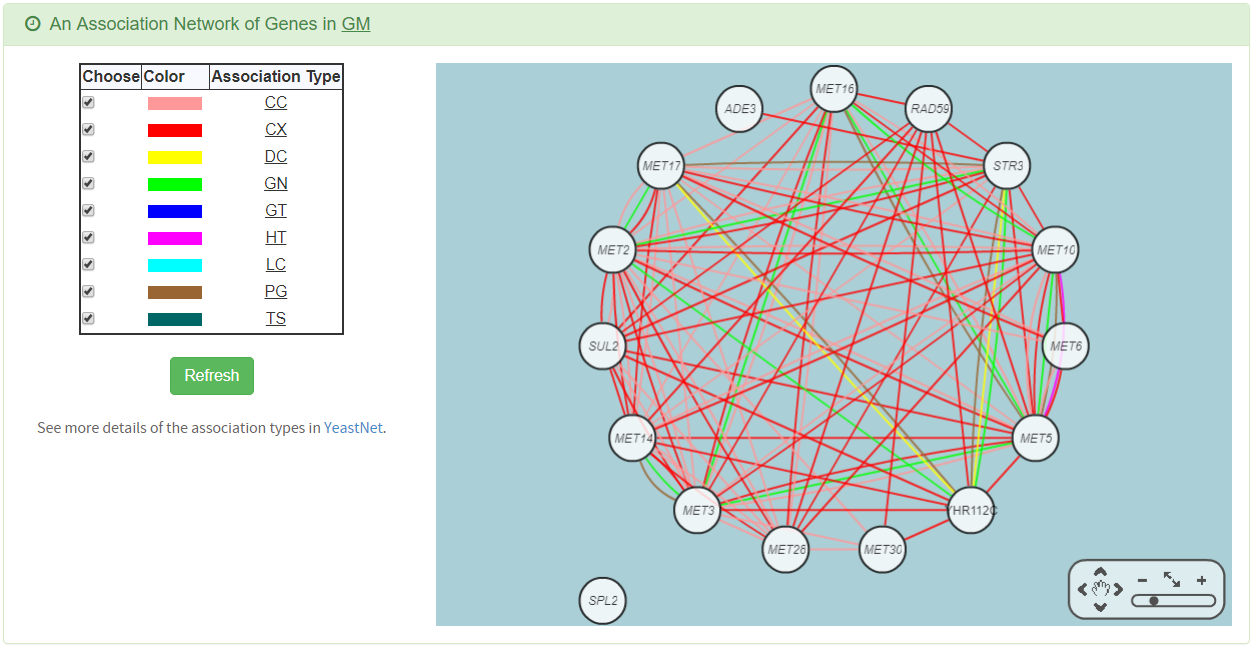
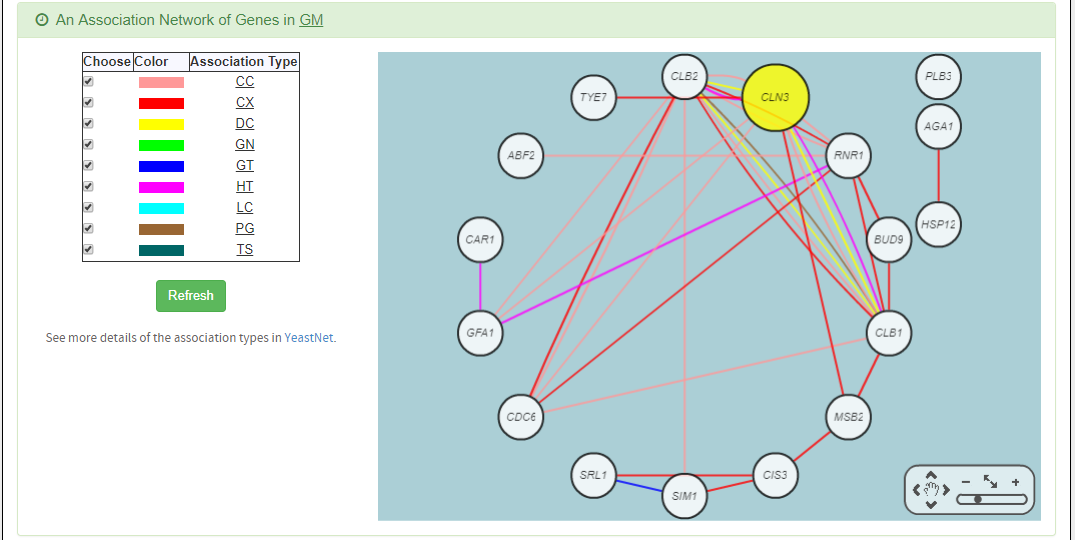
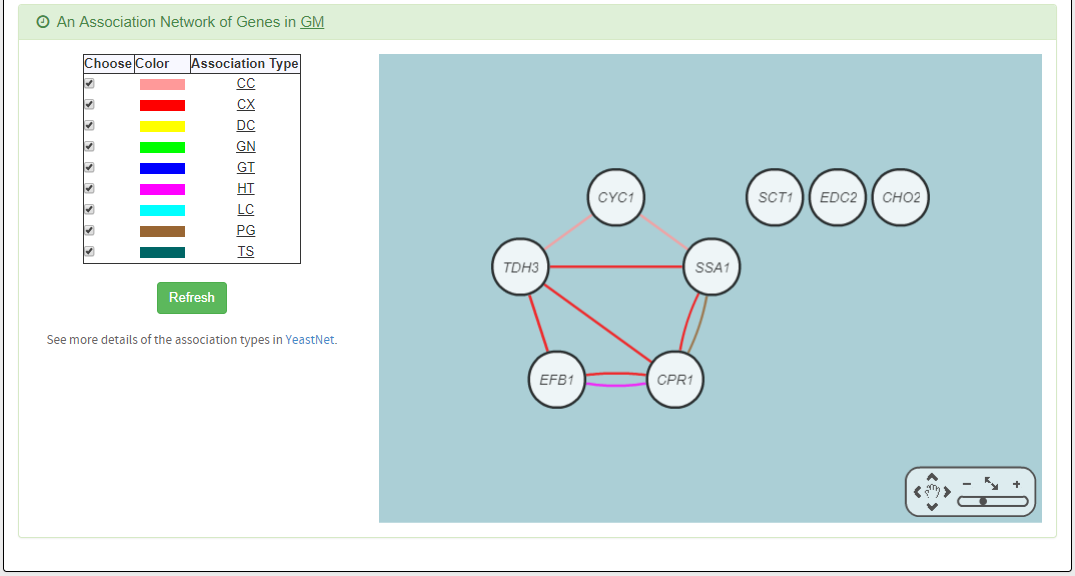
- An association network for the target GM is constructed. An edge between two genes exists if these two genes have at least one of the nine kinds of associations defined by YeastNet. Note that if a GM is of biological relevance, we expect to see many edges in the network.
- The enriched GO terms and pathways of the GM are identified. Note that if a GM is of biological relevance, we expect to see some enriched GO terms and enriched pathways.
Second Search Mode:
In the second search mode (i.e. Search by a gene name), users have to select three settings: a gene of interest, the experimental evidence (TFB or TFB&TFR) of the regulatory associations, and a least number of genes that a GM must contain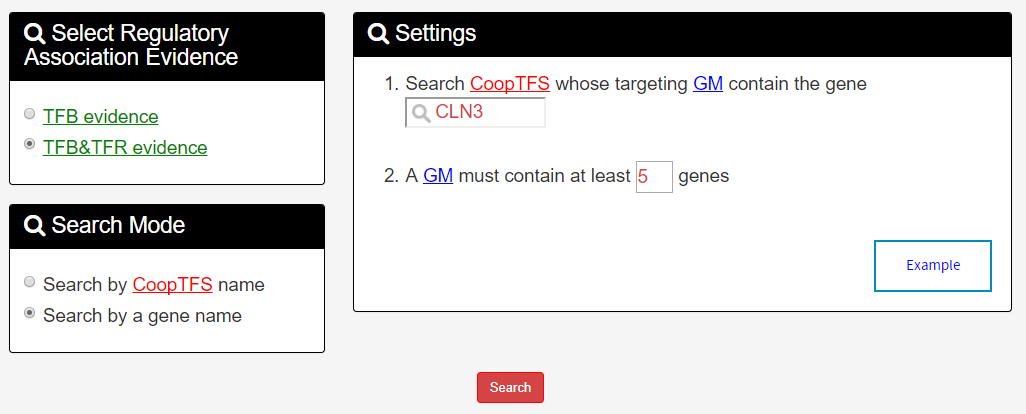
After submission, YGMD returns all possible CoopTFSs whose target GMs contain the gene of interest.
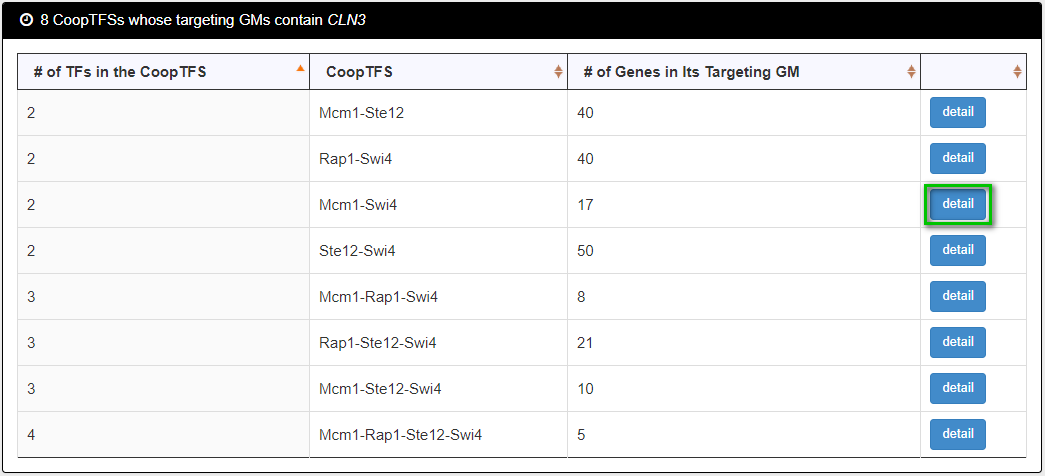
The detailed information of each CoopTFS could be found by clicking the “detail” button.
First Browse Mode:
In the first browse mode (i.e. browse by CoopTFS), users have to select two settings: the number of TFs in a CoopTFS and the experimental evidence (TFB or TFB&TFR) of the regulatory associations.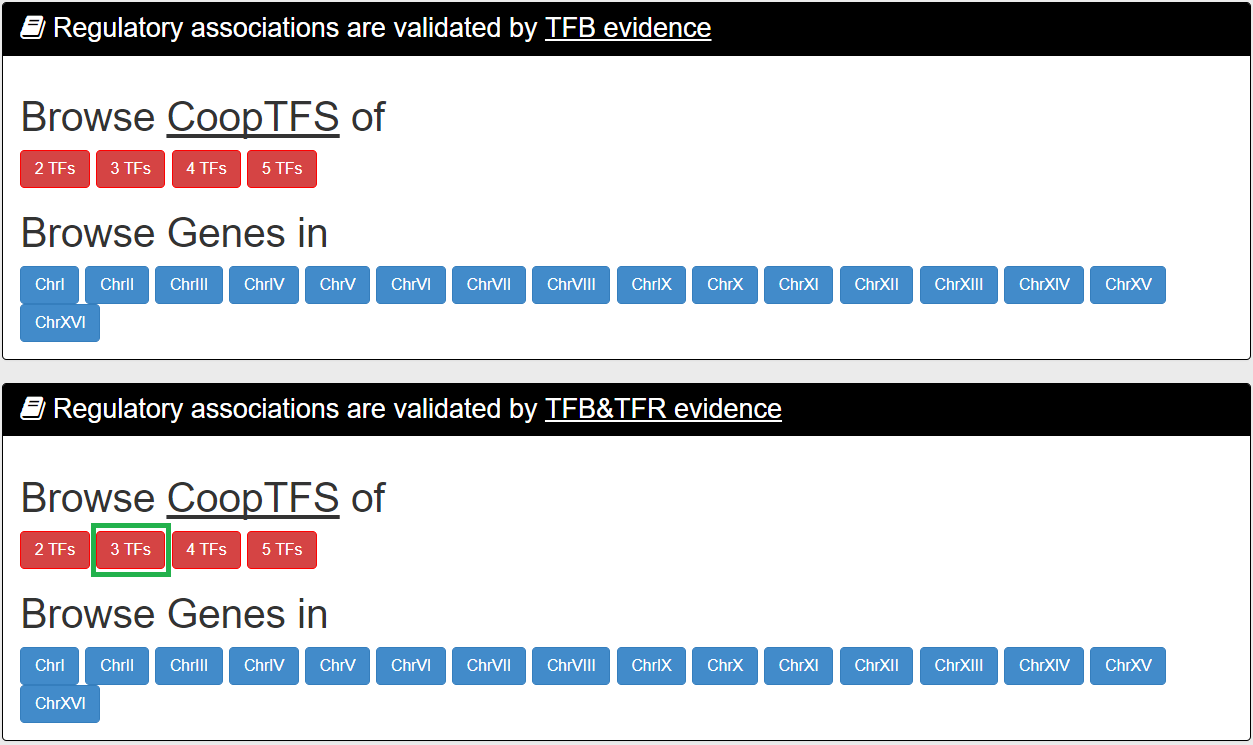
After submission, YGMD returns all CoopTFSs which satisfy the settings and have at least five (for choosing TFB&TFR) or fifteen (for choosing TFB) genes in its target GM.
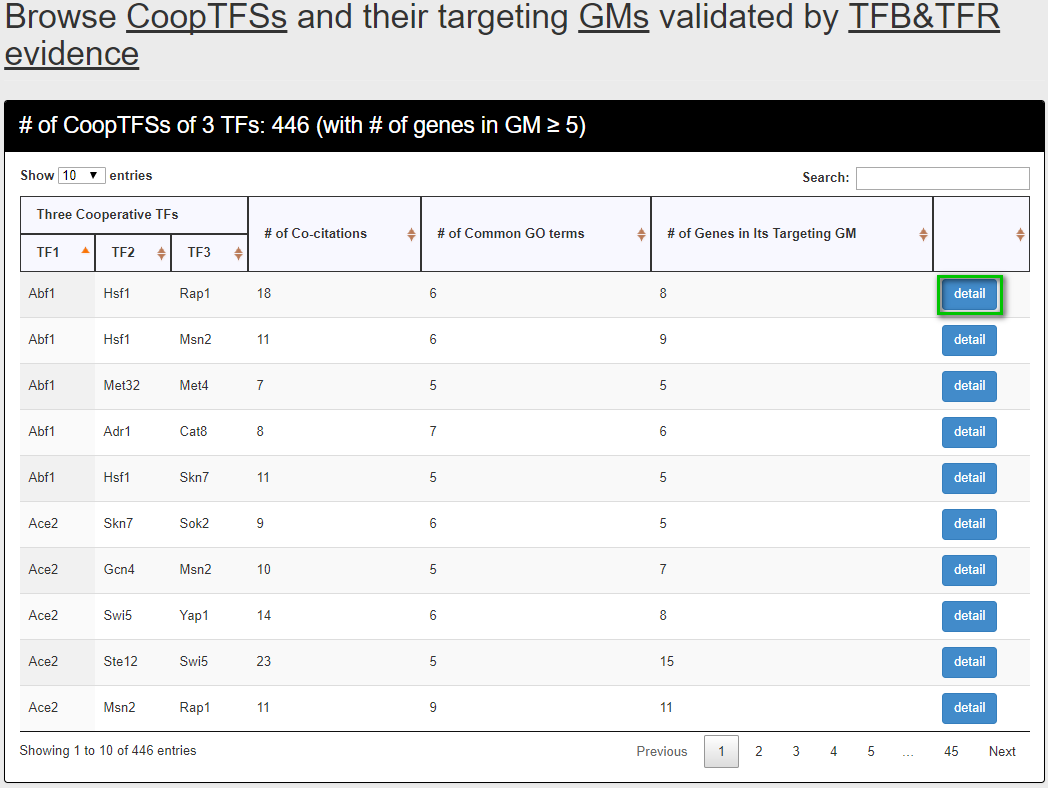
The detailed information of each CoopTFS could be found by clicking the “detail” button.
Second Browse Mode:
In the second browse mode (i.e. browse by chromosomes), users have to select two settings: a specific chromosome of interest and the experimental evidence (TFB or TFB&TFR) of the regulatory associations.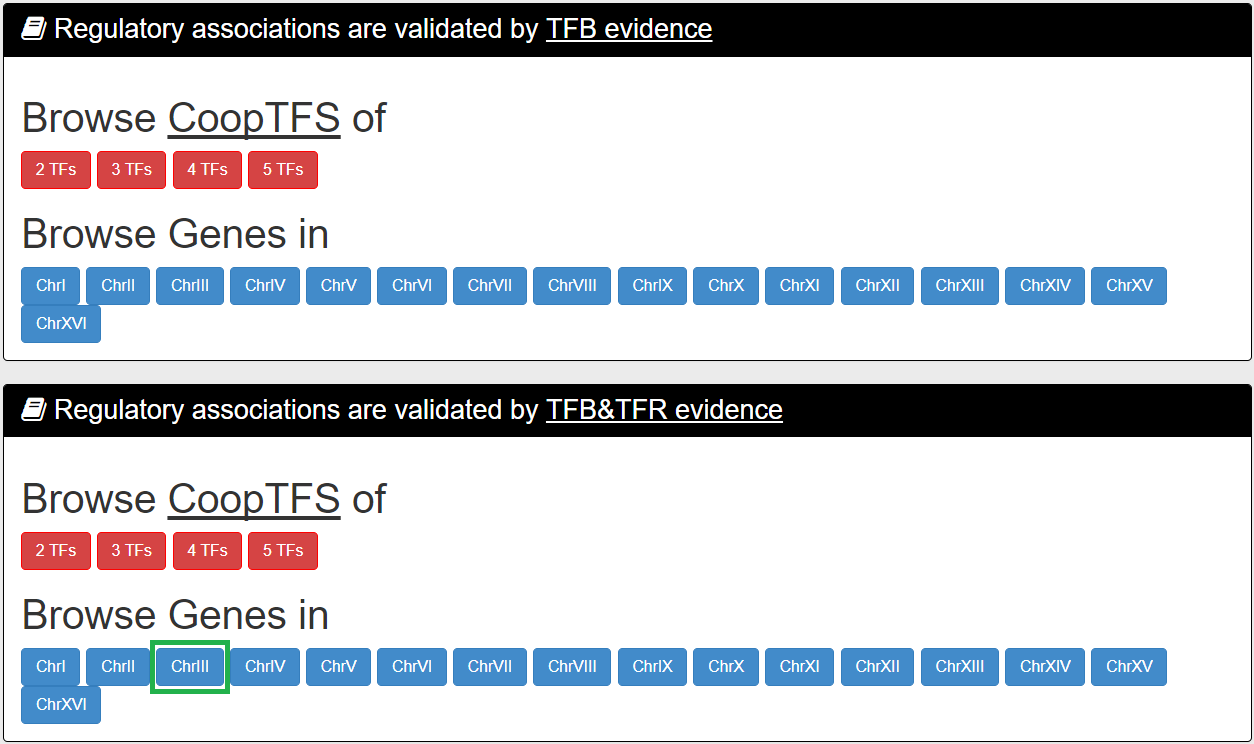
After submission, YGMD returns all genes in that specific chromosome. For each gene, the number of all possible CoopTFSs whose target GMs contain the gene of interest is shown.
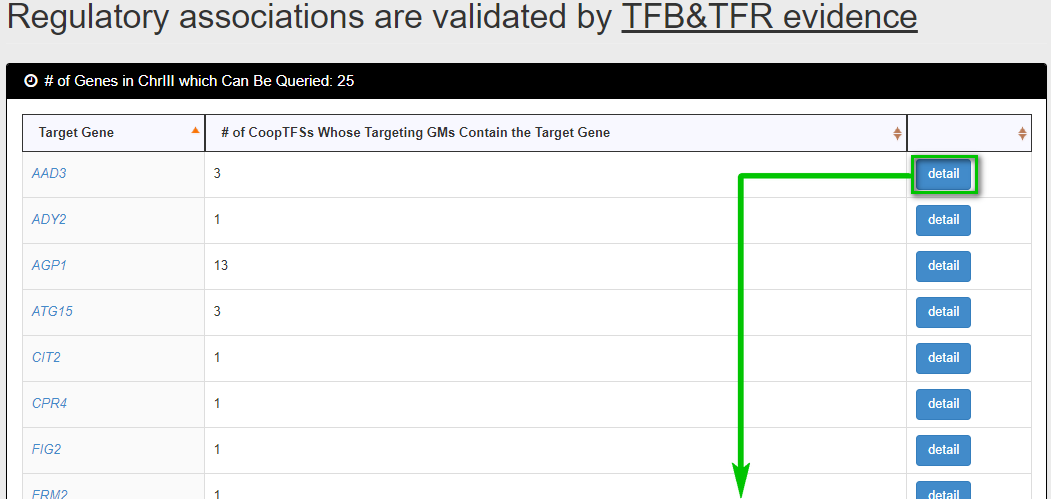
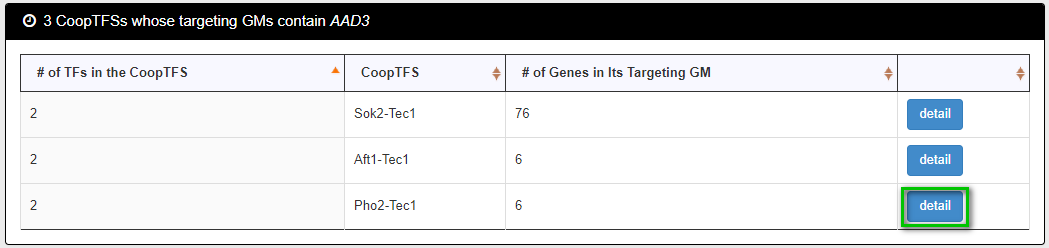
The detailed information of each CoopTFS could be found by clicking the “detail” button.